PHP性能分析工具-禅道XHProf+UI展示使用指北
PHP性能分析工具-禅道XHProf+UI展示使用指北
本文写于:2022/11/21,后续更新可能出现未涉及bug,请善用Google,可以的话,顺便补充在本文档 待补充 章节下,谢谢!
本机环境:
OS:Ubuntu LTS 20.04
PHP: php7.4.3
XHProf:v2.3.8
Graphviz:7.0.2
一、安装XHProf
- 给出两种安装方式:(如果有得选,推荐自行编译安装)
- 编译安装:对php版本无要求,可靠
- 直接引入编译好的so文件:需要与php版本对应的so文件
1、编译安装:
拉取源代码:
1
git clone https://github.com/longxinH/xhprof.git
编译安装:
1
2
3
4
5
6
cd xhprof/extension
phpize
./configure
make
make test
make insatll #权限不足请sudo添加XHProf.so 拓展
make install之后,将so文件引入到php.ini中
查看php.ini路径
1
2
3
4
5
6
7
8
9
10
11
12
13
14
15
16
17
18
ubuntu@VM-0-5-ubuntu:~/xhprof/extension$ php-config
Usage: /usr/bin/php-config [OPTION]
Options:
--prefix [/usr]
--includes [-I/usr/include/php/20190902 -I/usr/include/php/20190902/main -I/usr/include/php/20190902/TSRM -I/usr/include/php/20190902/Zend -I/usr/include/php/20190902/ext -I/usr/include/php/20190902/ext/date/lib ]
--ldflags [-L/usr/lib/php/20190902 ]
--libs [-lcrypt -largon2 -lresolv -lcrypt -lrt -lm -ldl -lxml2 -lssl -lcrypto -lpcre2-8 -lz -lsodium -lcrypt -largon2 -lcrypt ]
--extension-dir [/usr/lib/php/20190902]
--include-dir [/usr/include/php/20190902]
--man-dir [/usr/share/man]
--php-binary [/usr/bin/php7.4]
--php-sapis [apache2handler cgi cli fpm ]
--phpapi [20190902]
--ini-path [/etc/php/7.4/cli]
--ini-dir [/etc/php/7.4/cli/conf.d]
--configure-options [--includedir=/usr/include --mandir=/usr/share/man --infodir=/usr/share/info --disable-silent-rules --libdir=/usr/lib/x86_64-linux-gnu --libexecdir=/usr/lib/x86_64-linux-gnu --disable-maintainer-mode --disable-dependency-tracking --prefix=/usr --enable-cli --disable-cgi --disable-phpdbg --with-config-file-path=/etc/php/7.4/cli --with-config-file-scan-dir=/etc/php/7.4/cli/conf.d --build=x86_64-linux-gnu --host=x86_64-linux-gnu --config-cache --cache-file=/build/php7.4-6KO5GW/php7.4-7.4.3/config.cache --libdir=${prefix}/lib/php --libexecdir=${prefix}/lib/php --datadir=${prefix}/share/php/7.4 --program-suffix=7.4 --sysconfdir=/etc --localstatedir=/var --mandir=/usr/share/man --disable-all --disable-debug --disable-rpath --disable-static --with-pic --with-layout=GNU --without-pear --enable-filter --with-openssl --with-password-argon2=/usr --with-external-pcre --enable-hash --with-mhash=/usr --with-libxml --enable-session --with-sodium --with-system-tzdata --with-zlib=/usr --with-zlib-dir=/usr --enable-dtrace --enable-pcntl --with-libedit=shared,/usr build_alias=x86_64-linux-gnu host_alias=x86_64-linux-gnu CFLAGS=-g -O2 -fdebug-prefix-map=/build/php7.4-6KO5GW/php7.4-7.4.3=. -fstack-protector-strong -Wformat -Werror=format-security -O2 -Wall -pedantic -fsigned-char -fno-strict-aliasing -g]
--version [7.4.3]
--vernum [70403]其中的–ini-path即为php.ini的路径
编辑
/etc/php/7.4/cli/php.ini、/etc/php/7.4/php-fpm/php.ini、/etc/php/7.4/apache2/php.ini1
2
3
4
5
6#文件末尾添加
[XHProf]
extension=xhprof.so
#log文件输出地址,自行选择,记得赋权
#如果放在/tmp下记得查看php是否自定了/tmp的位置
xhprof.output_dir=/var/log/xhprof重启php-fpm,apache2检查是否安装成功
1
2
3
4
5
6
7
8
9
10
11
12
13
14
15
16
17
18
19
20
21
22
23
24
25
26
27
28
29
30
31
32
33
34
35
36
37
38
39
40
41
42
43
44
45
46
47
48
49
50
51
52
53
54ubuntu@VM-0-5-ubuntu:/etc/php/7.4/fpm$ sudo service apache2 restart
ubuntu@VM-0-5-ubuntu:/etc/php/7.4/fpm$ sudo service php7.4-fpm restart
ubuntu@VM-0-5-ubuntu:/etc/php/7.4/fpm$ php -m
[PHP Modules]
calendar
Core
ctype
curl
date
dom
exif
FFI
fileinfo
filter
ftp
gd
gettext
hash
iconv
json
libxml
mbstring
mysqli
mysqlnd
openssl
pcntl
pcre
PDO
pdo_mysql
Phar
posix
readline
Reflection
session
shmop
SimpleXML
sockets
sodium
SPL
standard
sysvmsg
sysvsem
sysvshm
tokenizer
xhprof
xml
xmlreader
xmlwriter
xsl
Zend OPcache
zlib
[Zend Modules]
Zend OPcache如果出现xhprof则安装成功
2、直接引入编译好的so文件:
- 使用与目标机器相同的php版本进行编译,将编译后的so文件复制到目标机php的拓展目录下,修改php.ini,启用拓展
二、使用XHProf
1、将XHProf运行代码引入
将一开始拉取的XHProf代码中
xhprof_html文件夹引入到禅道的www/xhprof下
xhprof_lib文件夹引入到禅道的lib/xhprof下
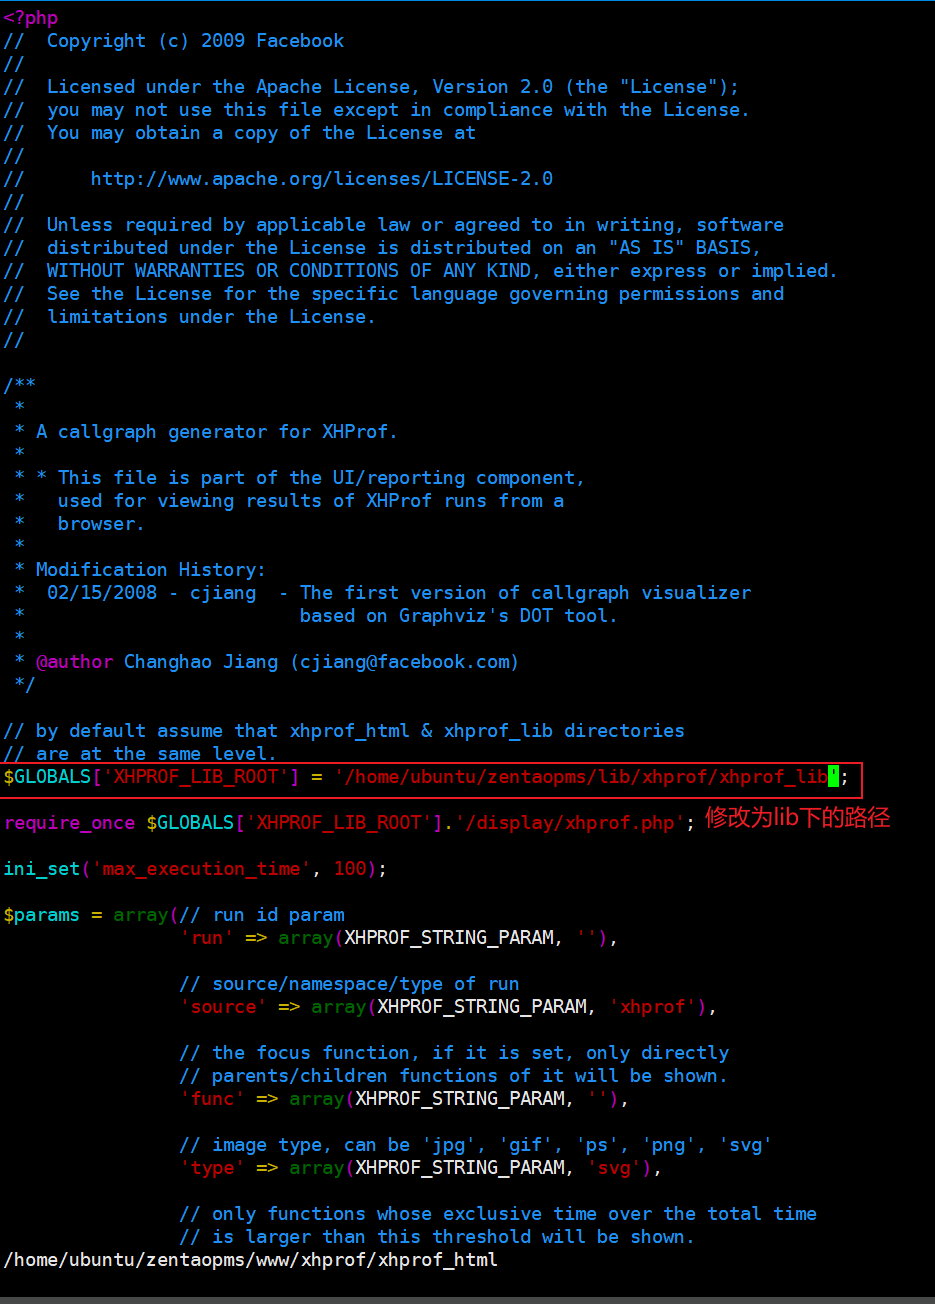
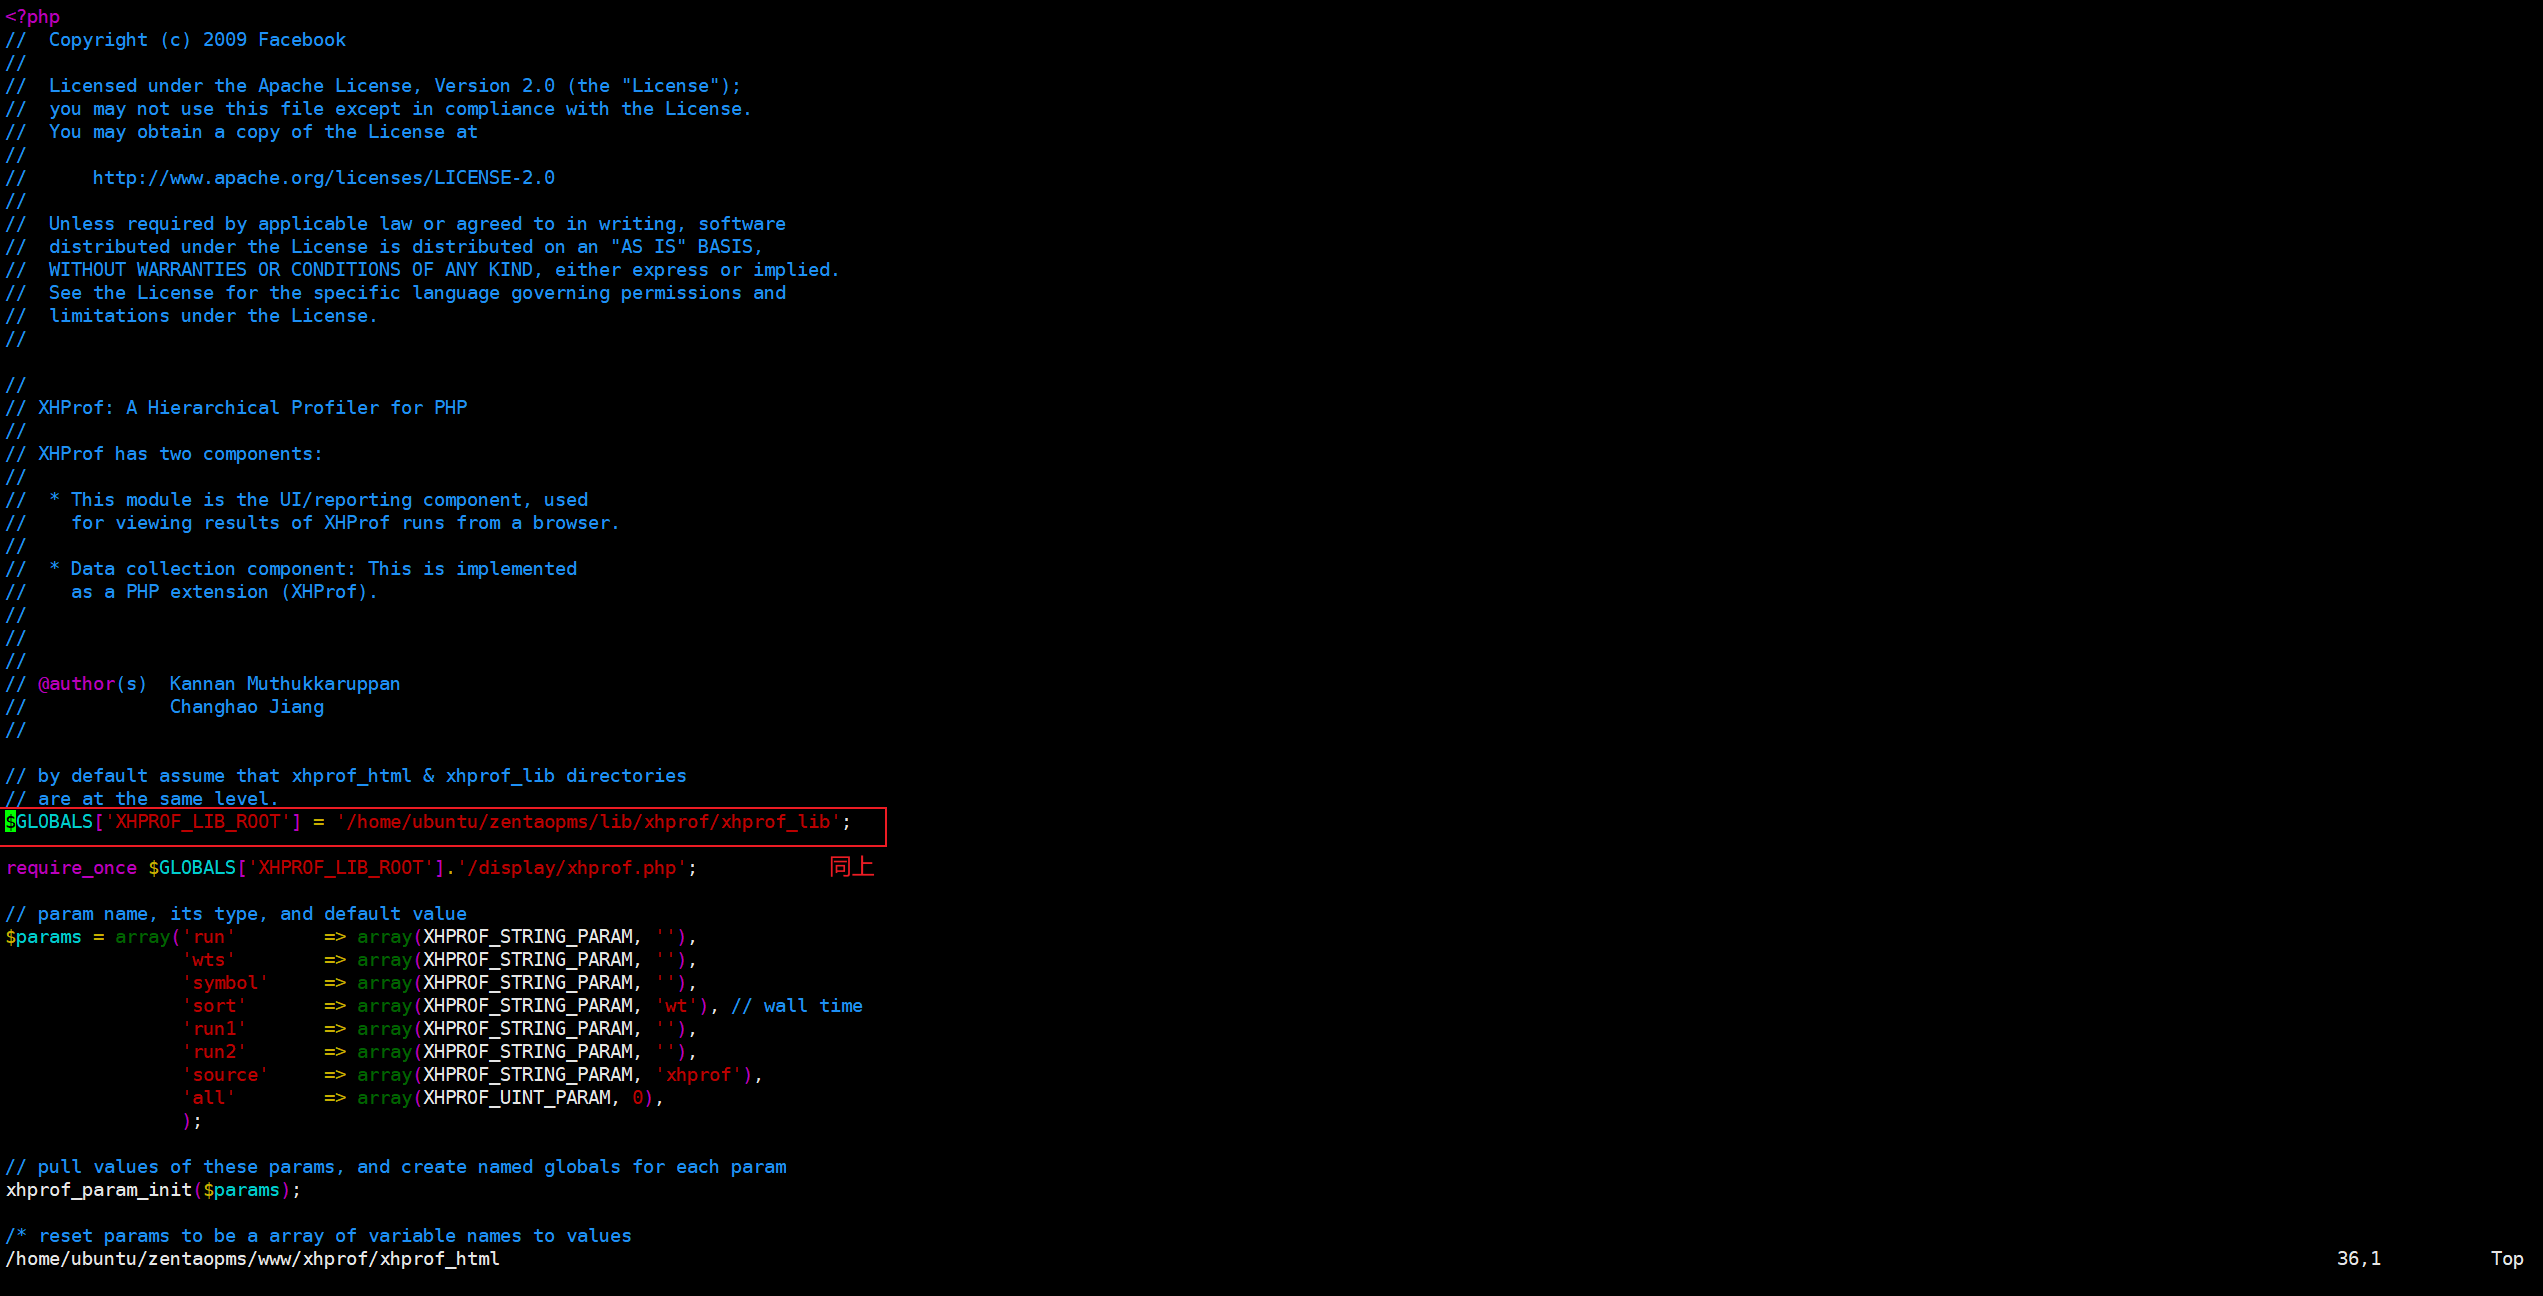
修改xhprof_html文件中位置,适配禅道结构
修改callgraph.php和index.php
callgraph.php
index.php
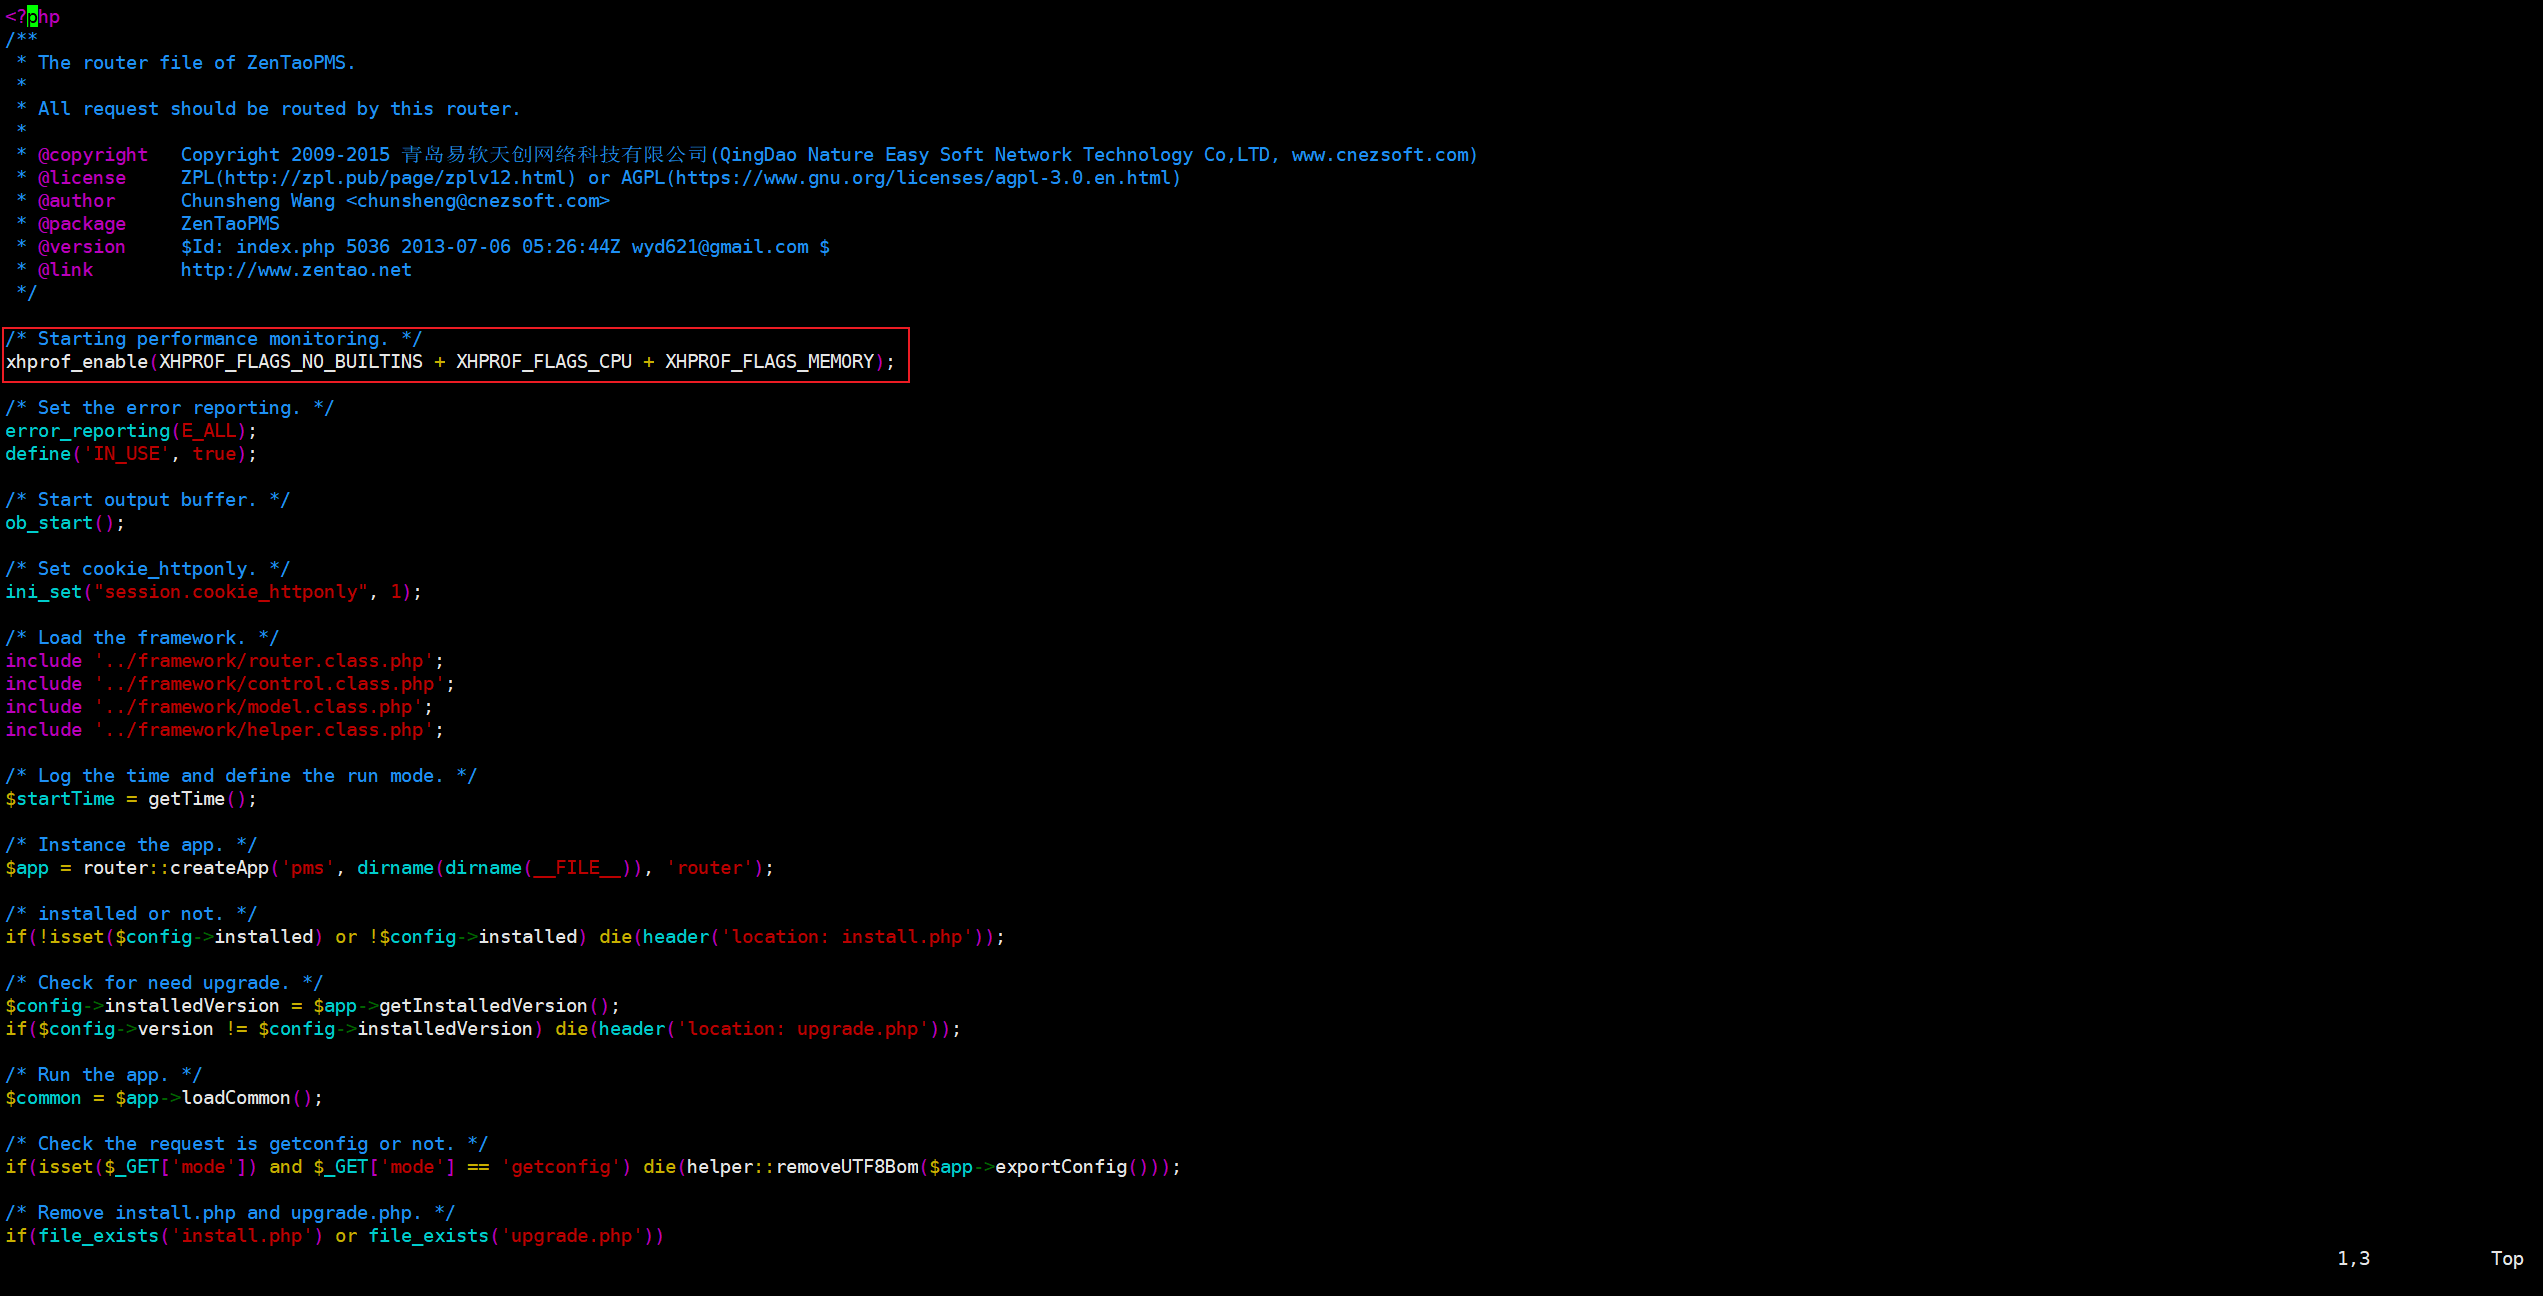
2、进入禅道www目录下,扩展index.php文件(也可直接修改index.php)
1 | cd www |
修改indexxhprof.php:
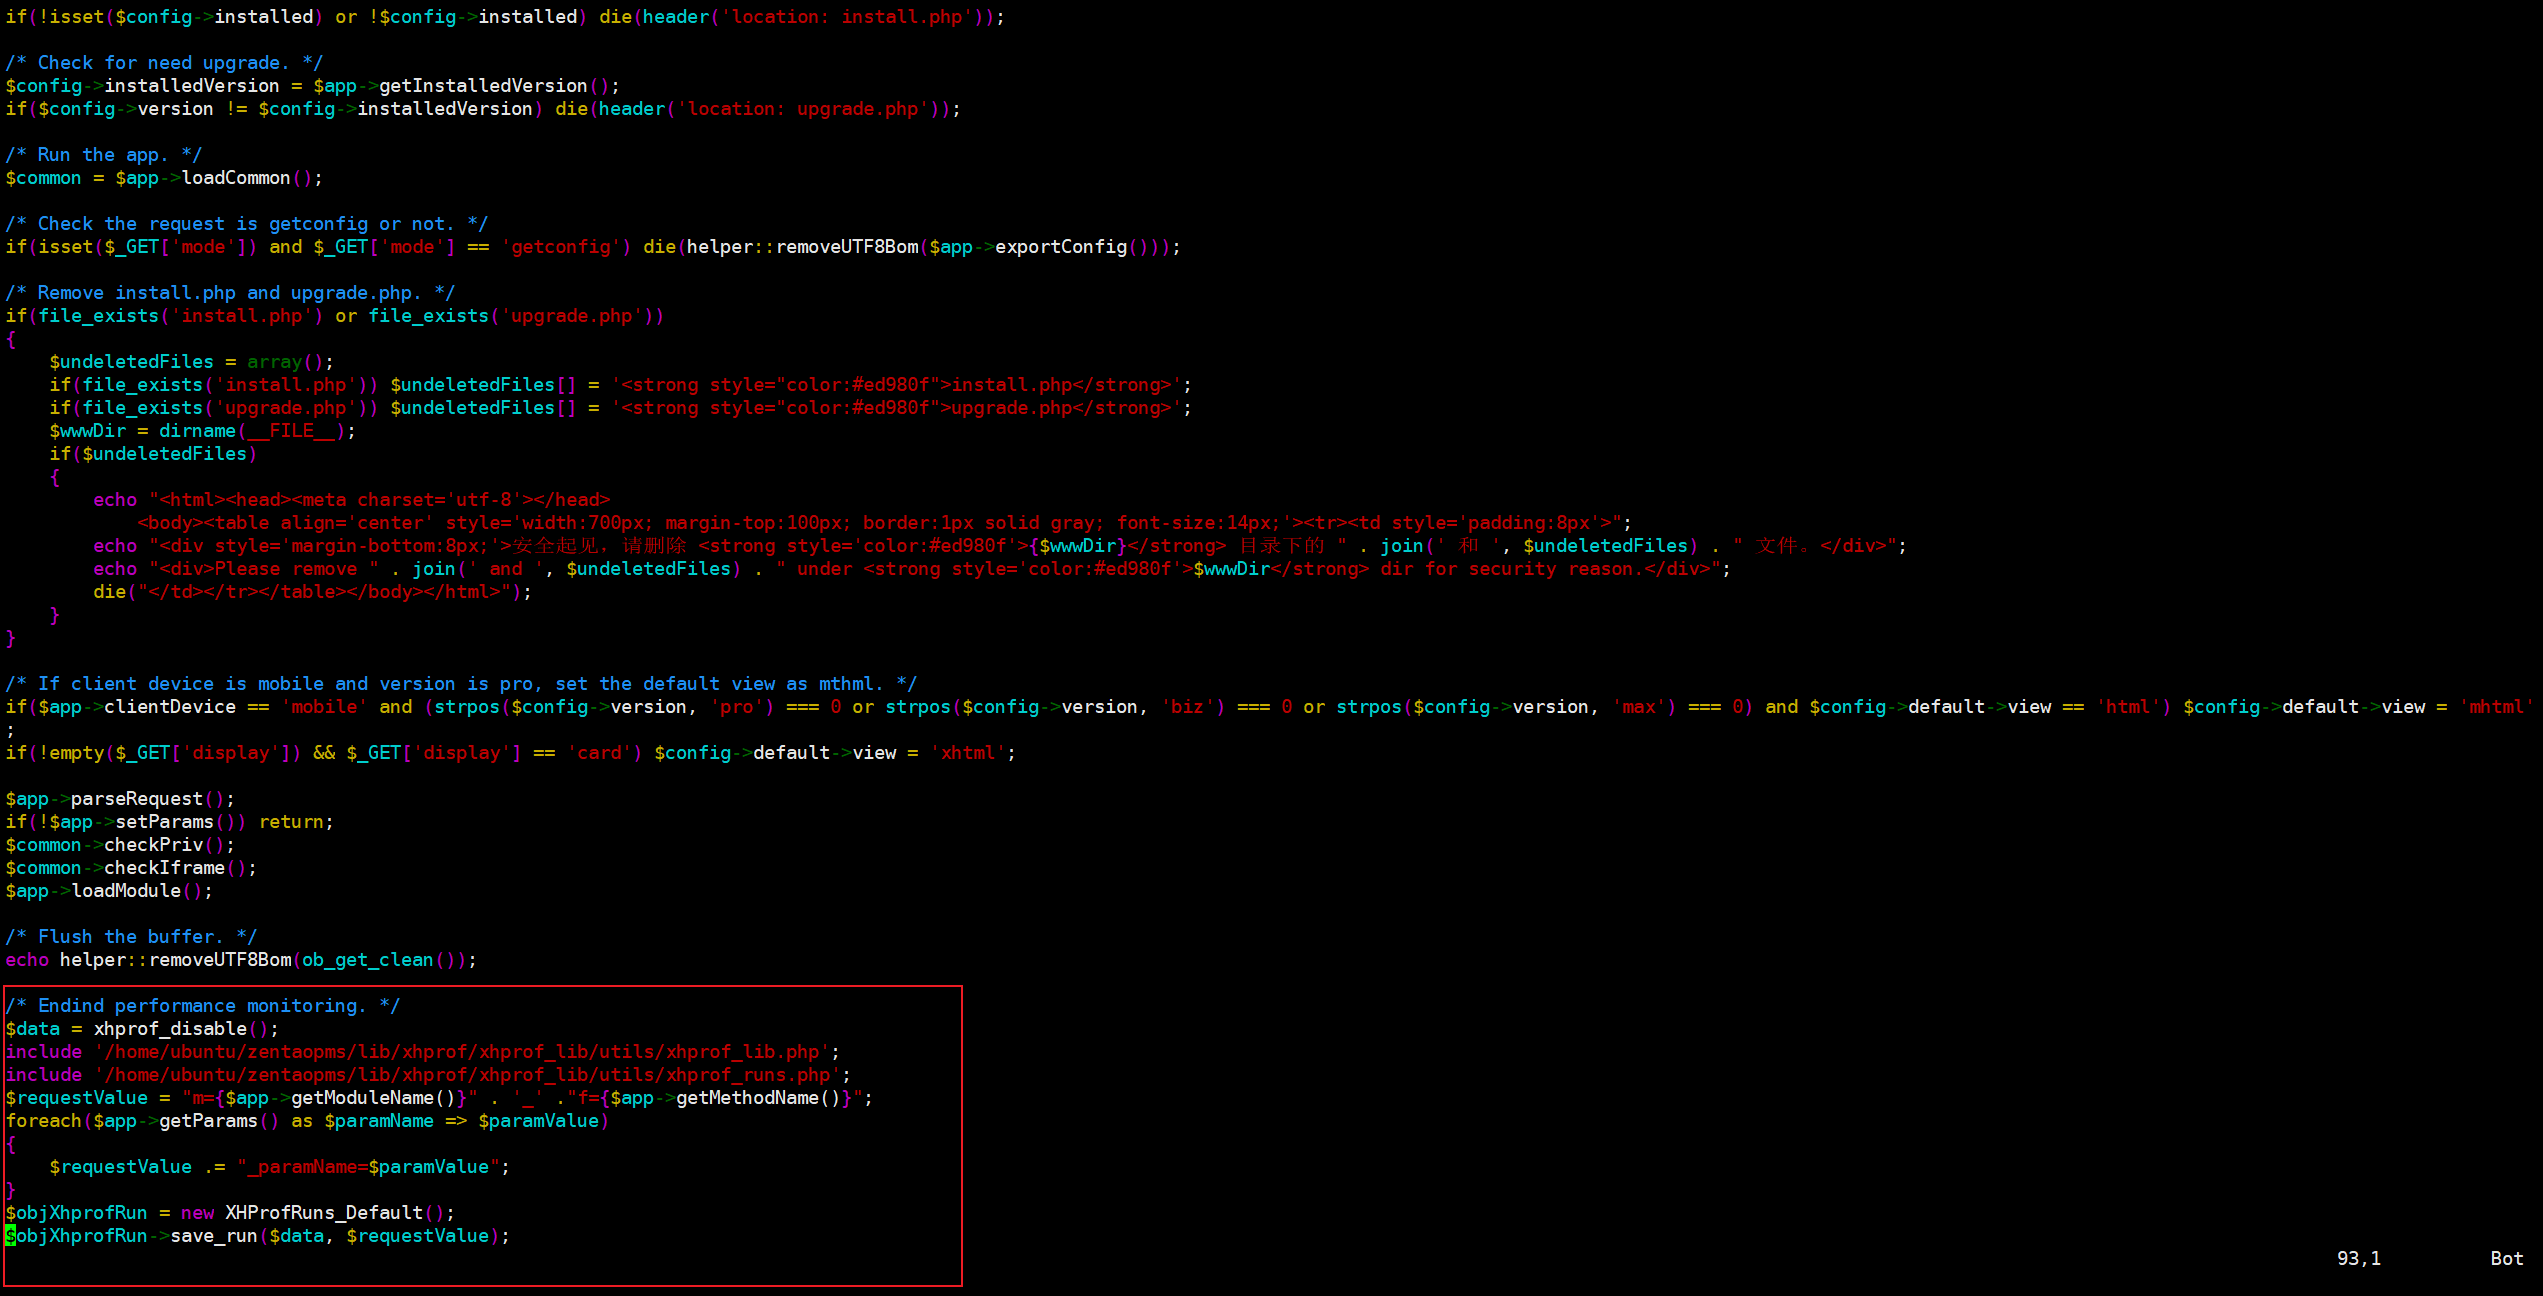
1 | #如下图位置增加监控代码: |
文件开头:
文件末尾:
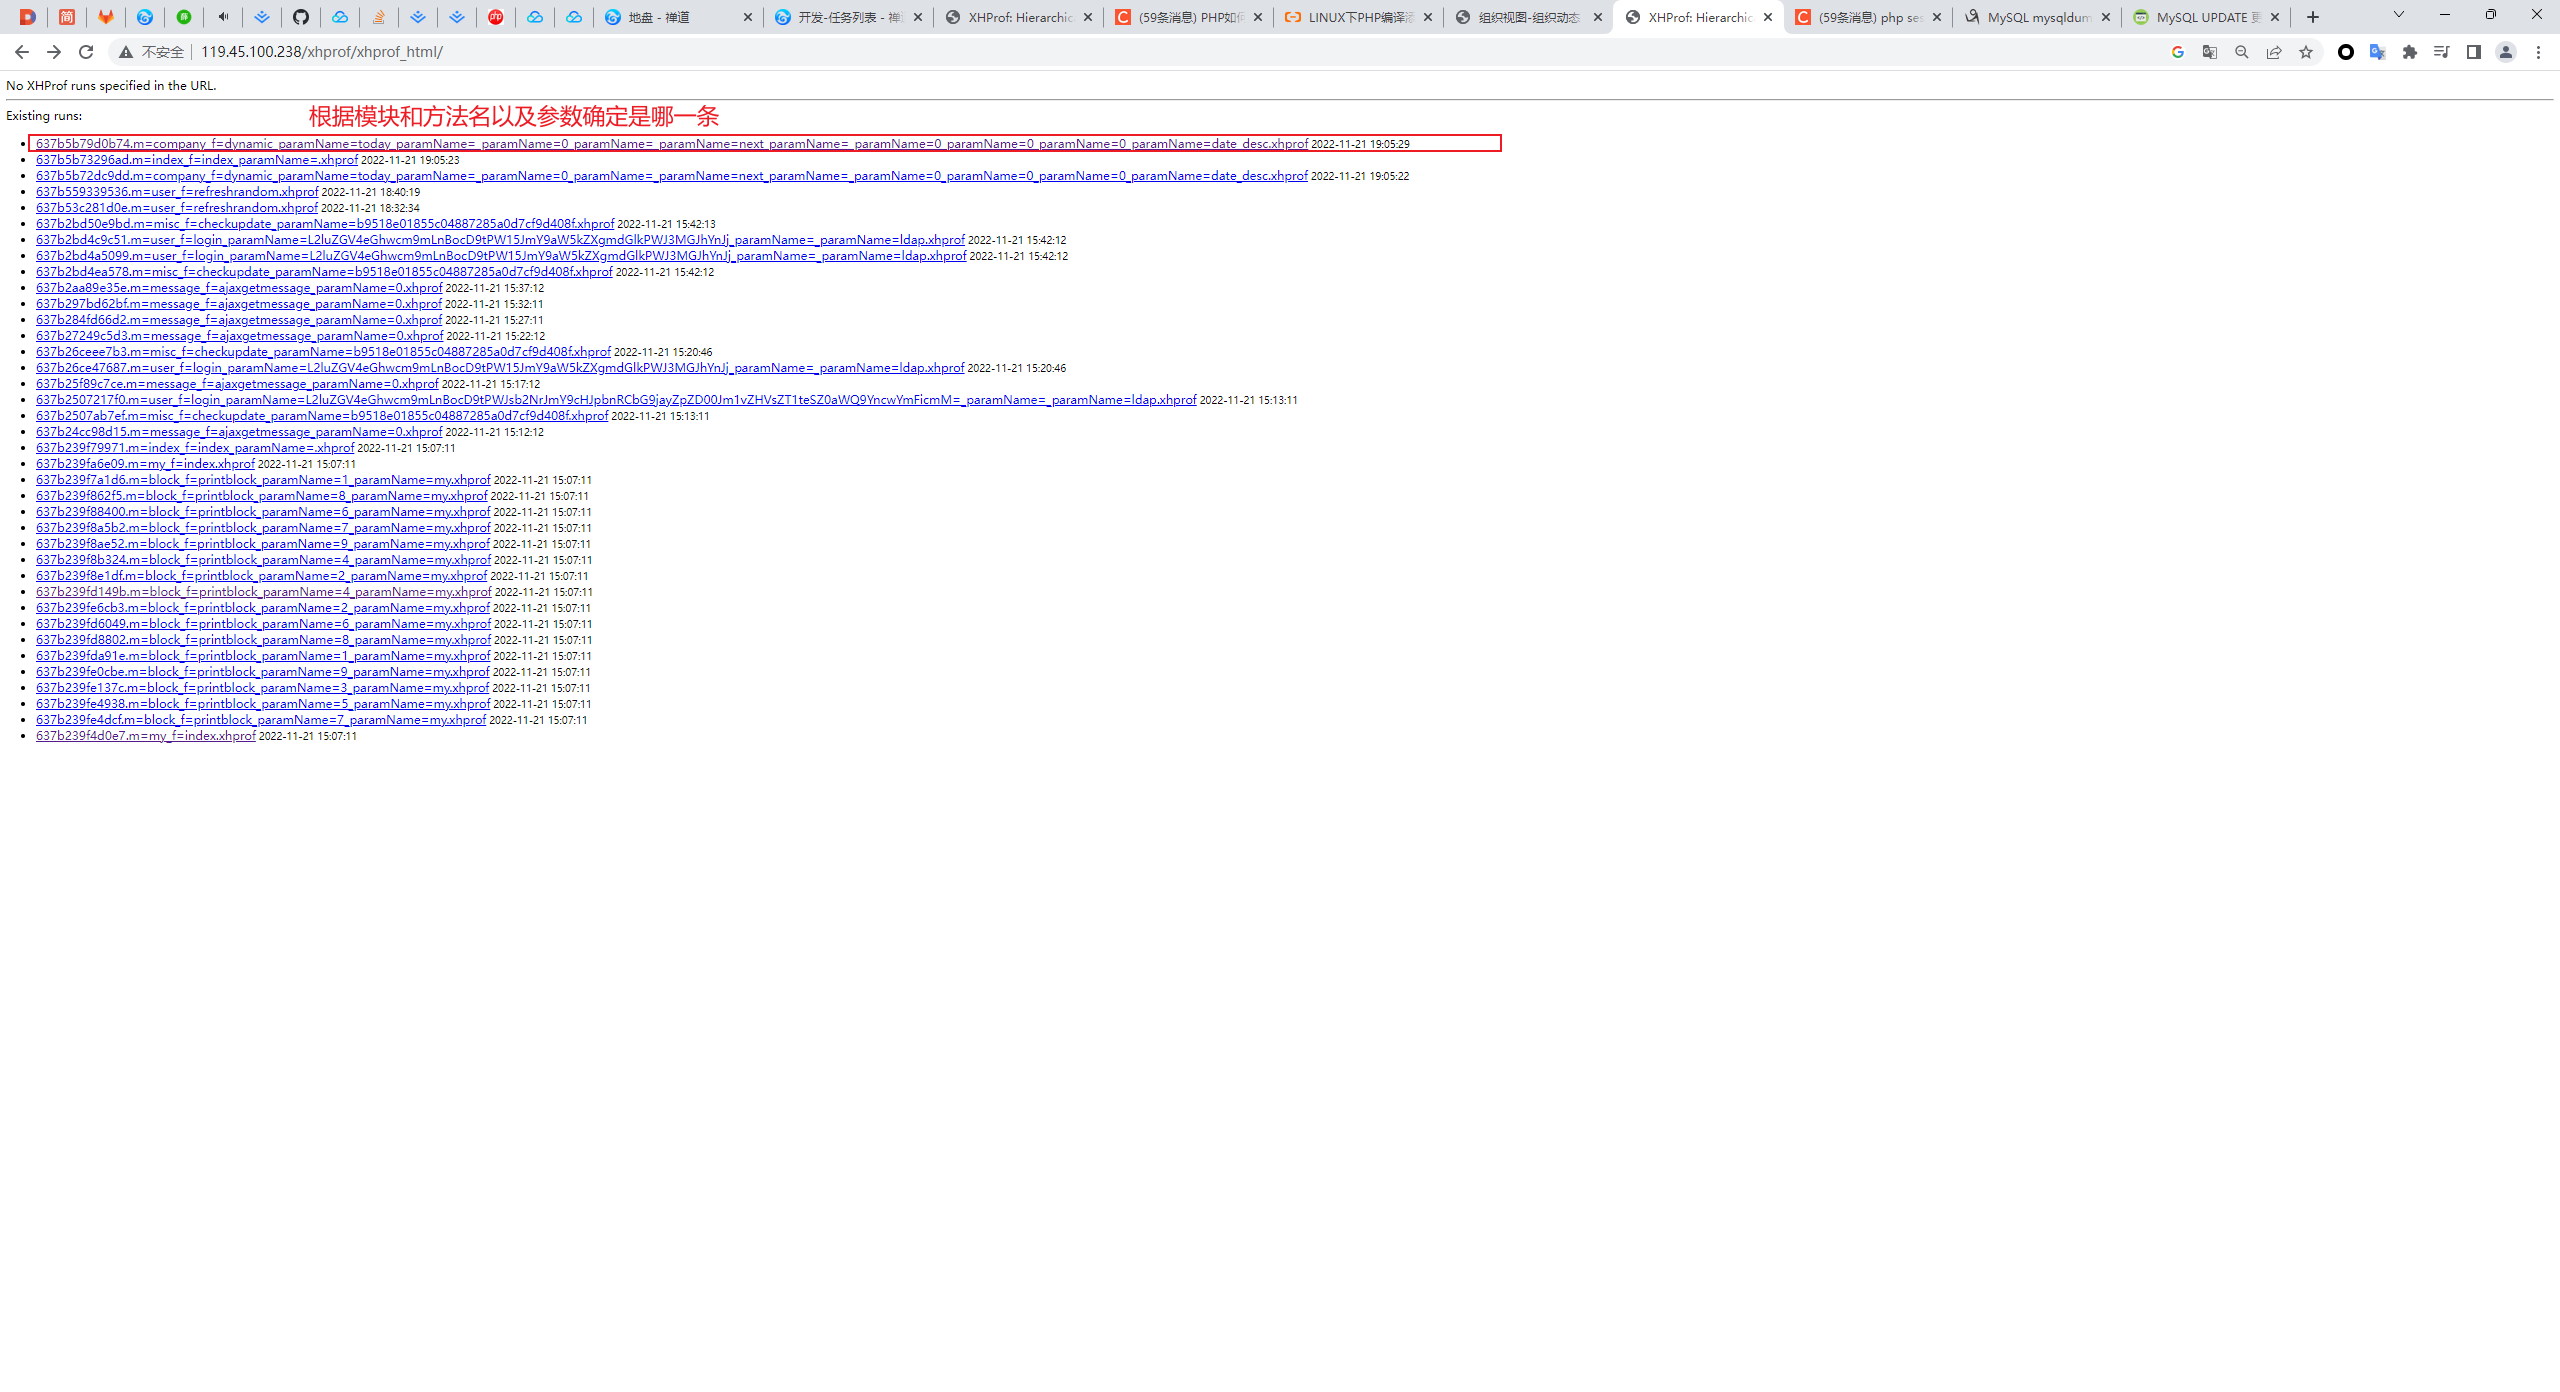
3、访问url查看结果:
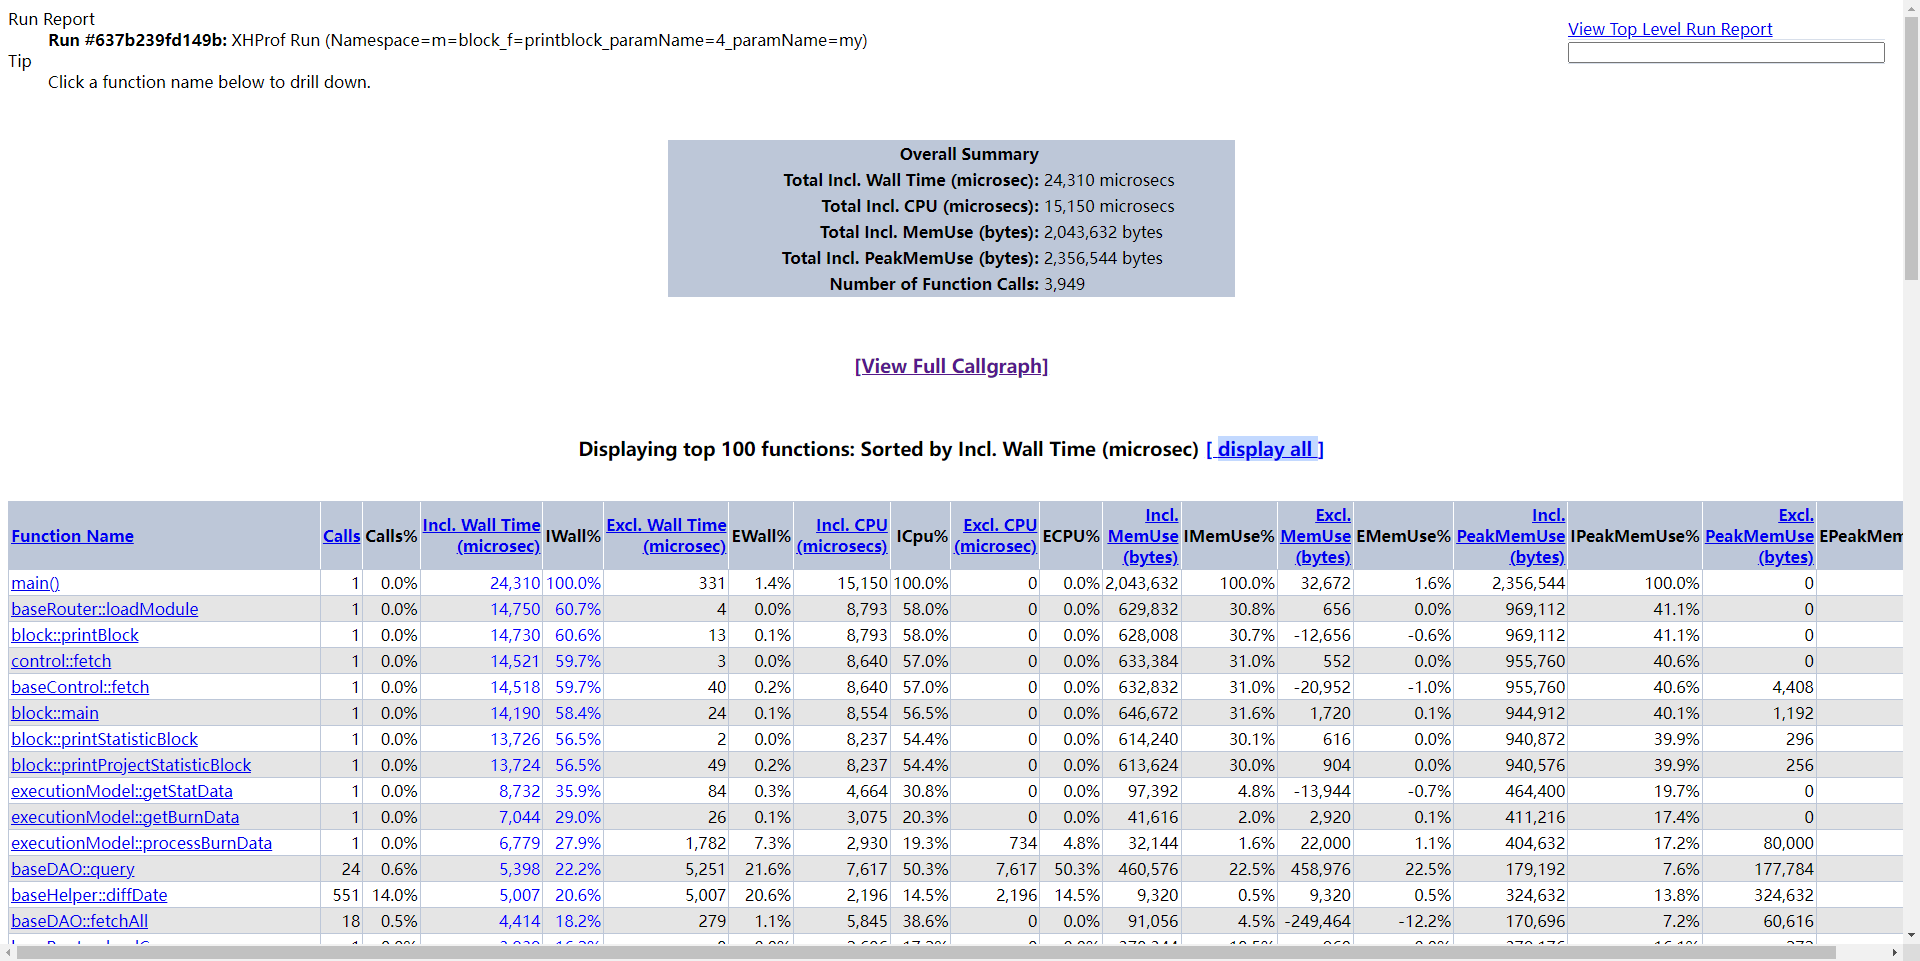
我们最上面部分是请求的接口指标总览, 下面是具体的每个调用函数的执行情况。
| 字段名 | 含义 |
|---|---|
| Calls | 调用次数 |
| Incl. Wall Time | 调用的包括子函数所有花费时间,以微秒算 |
| Excl. Wall Time | 函数执行本身花费的时间,不包括子树执行时间,以微秒算 |
| Incl. CPU | 调用的包括子函数所有花费的cpu时间 |
| Excl. CPU | 函数执行本身花费的cpu时间,不包括子树执行时间,以微秒算 |
| Incl.MemUse | 包括子函数执行使用的内存, 以字节算 |
| Excl.MemUse | 函数执行本身内存,以字节算 |
| Incl.PeakMemUse | Incl.MemUse的峰值 |
| Excl.PeakMemUse | Excl.MemUse的峰值 |
其余后面的 % 结尾均为对应的占比
三、为什么要用XHProf
只是一个性能分析的工具,比XDebug轻量化一点而已,或许更适合客户环境性能问题的定位和调试。
1、使用举例
举个例子:
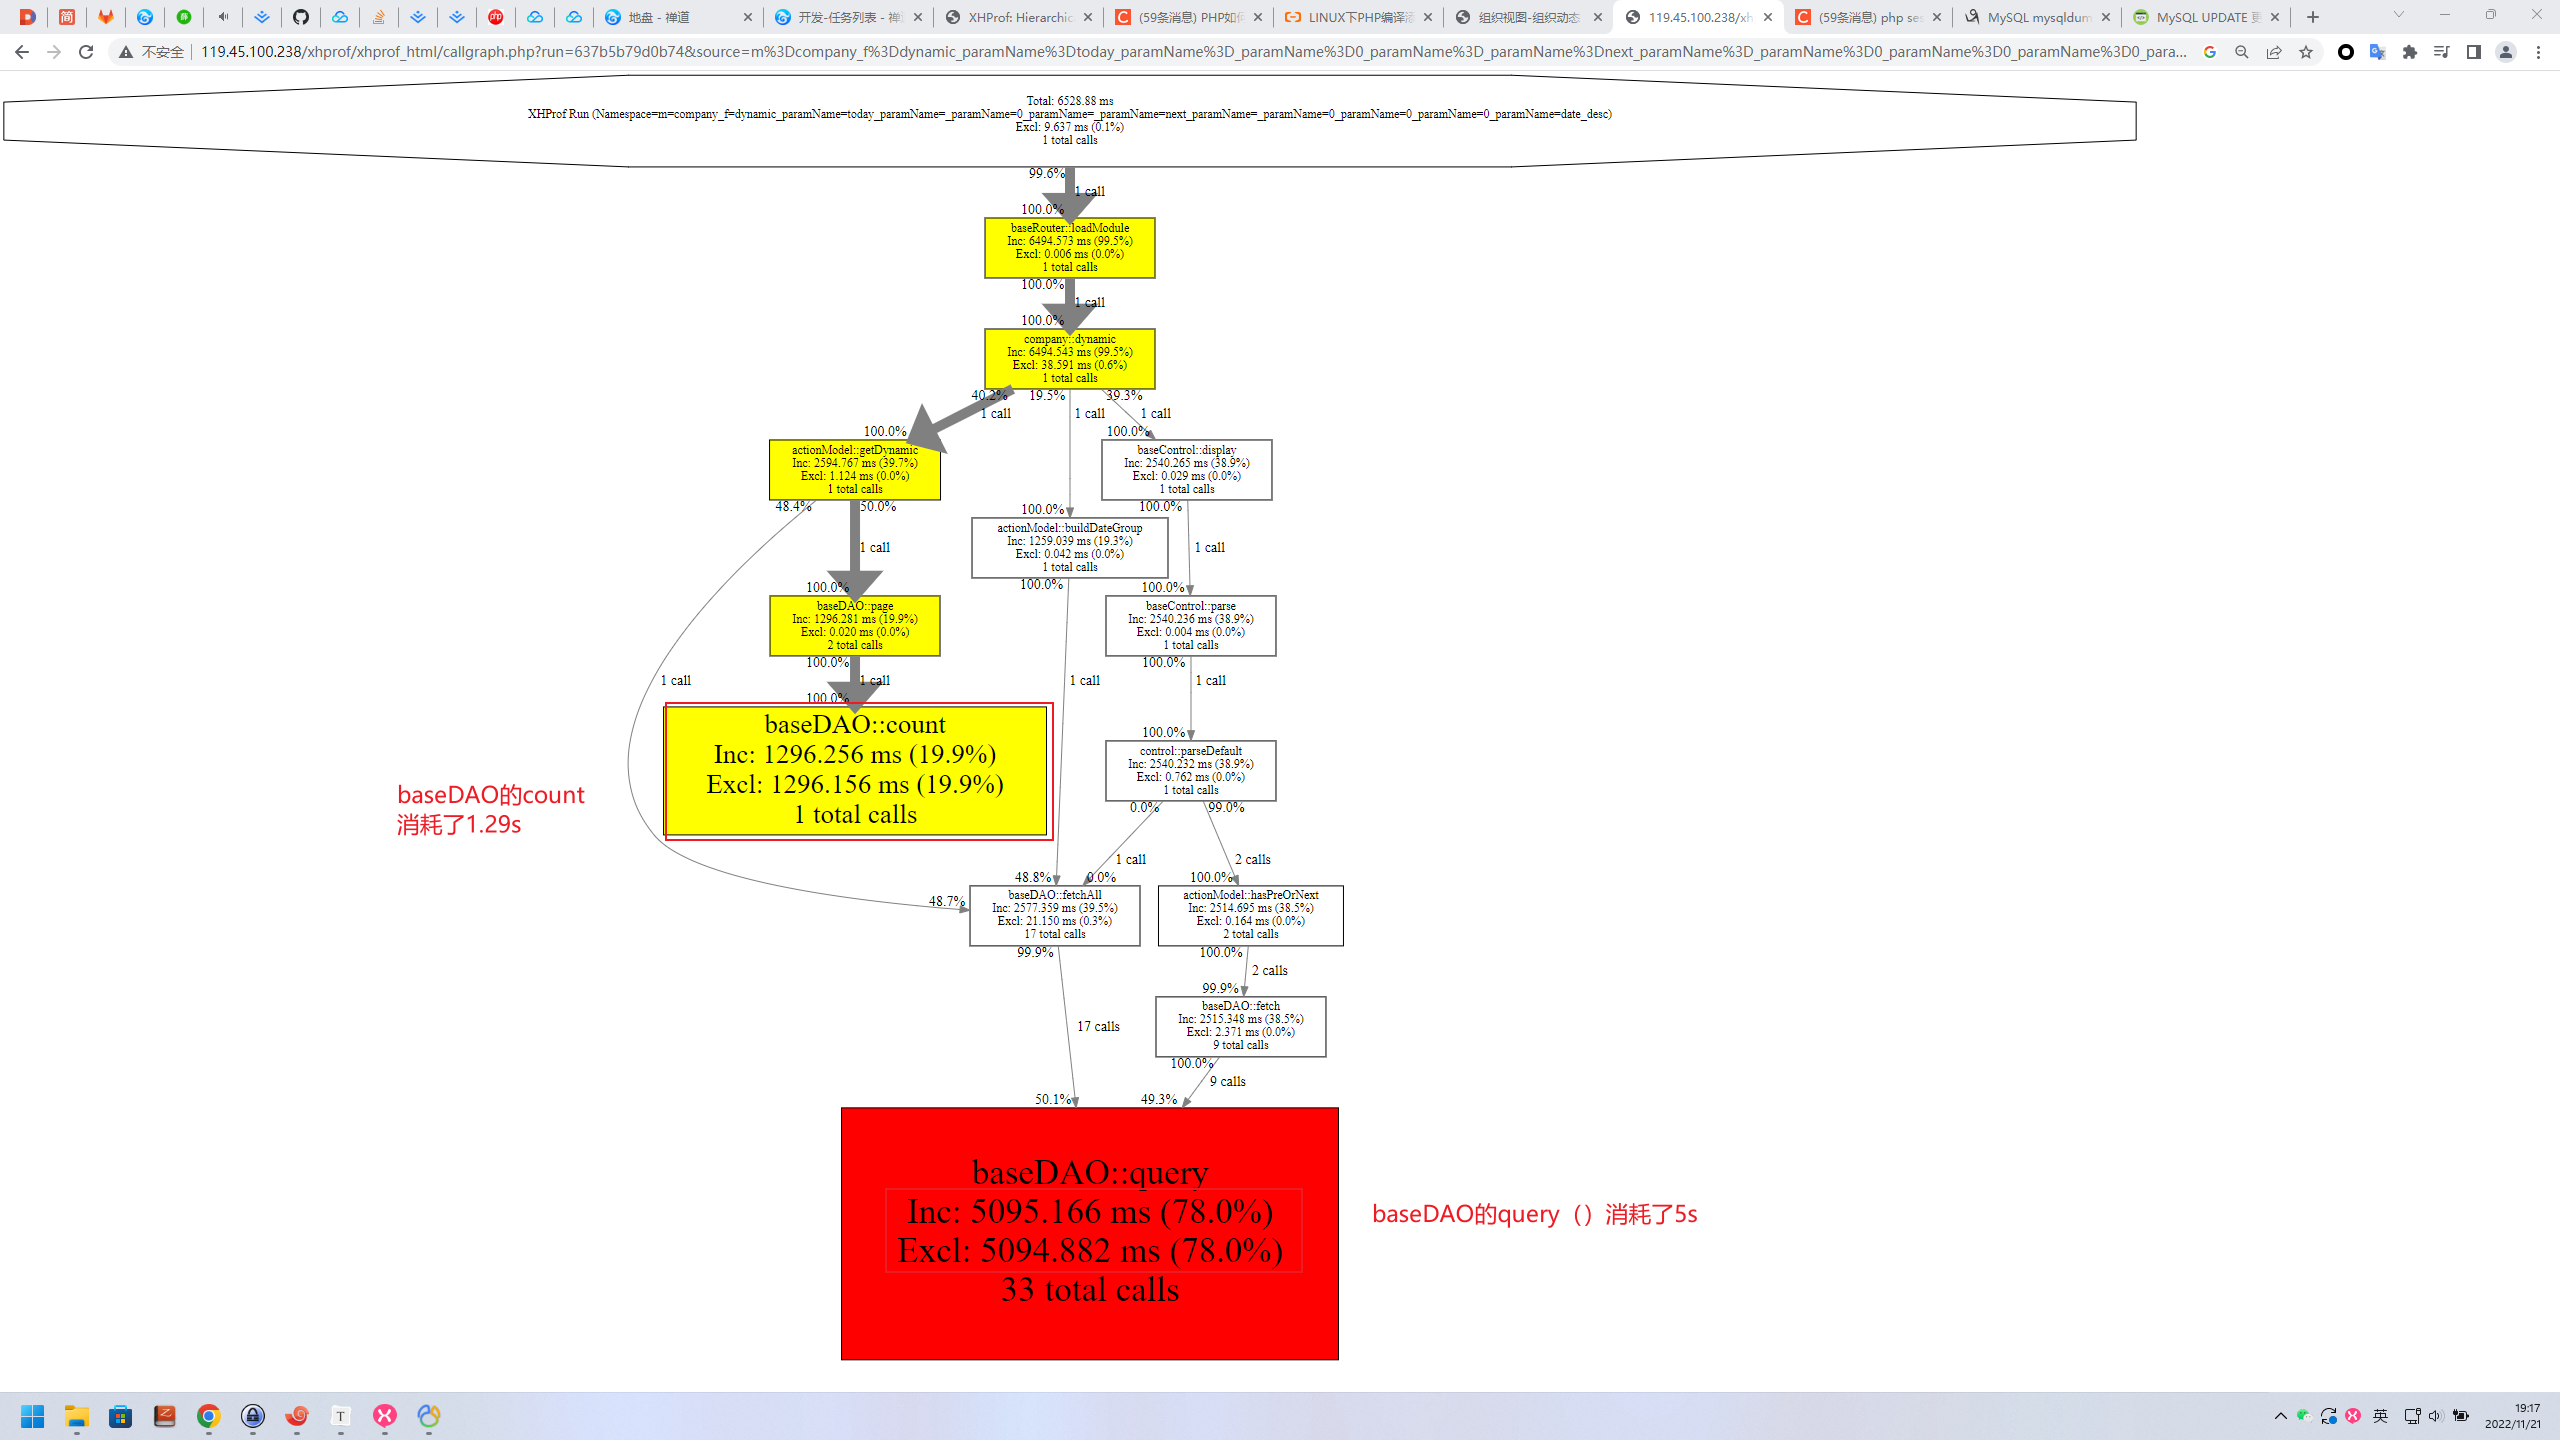
这个禅道环境数据量很大,仅仅是查询一个动态就要请求6.5s。无法查看函数调用栈的情况下,一般只能进control,二分打印时间,或者根据经验打断点看for循环和sql的执行时间。
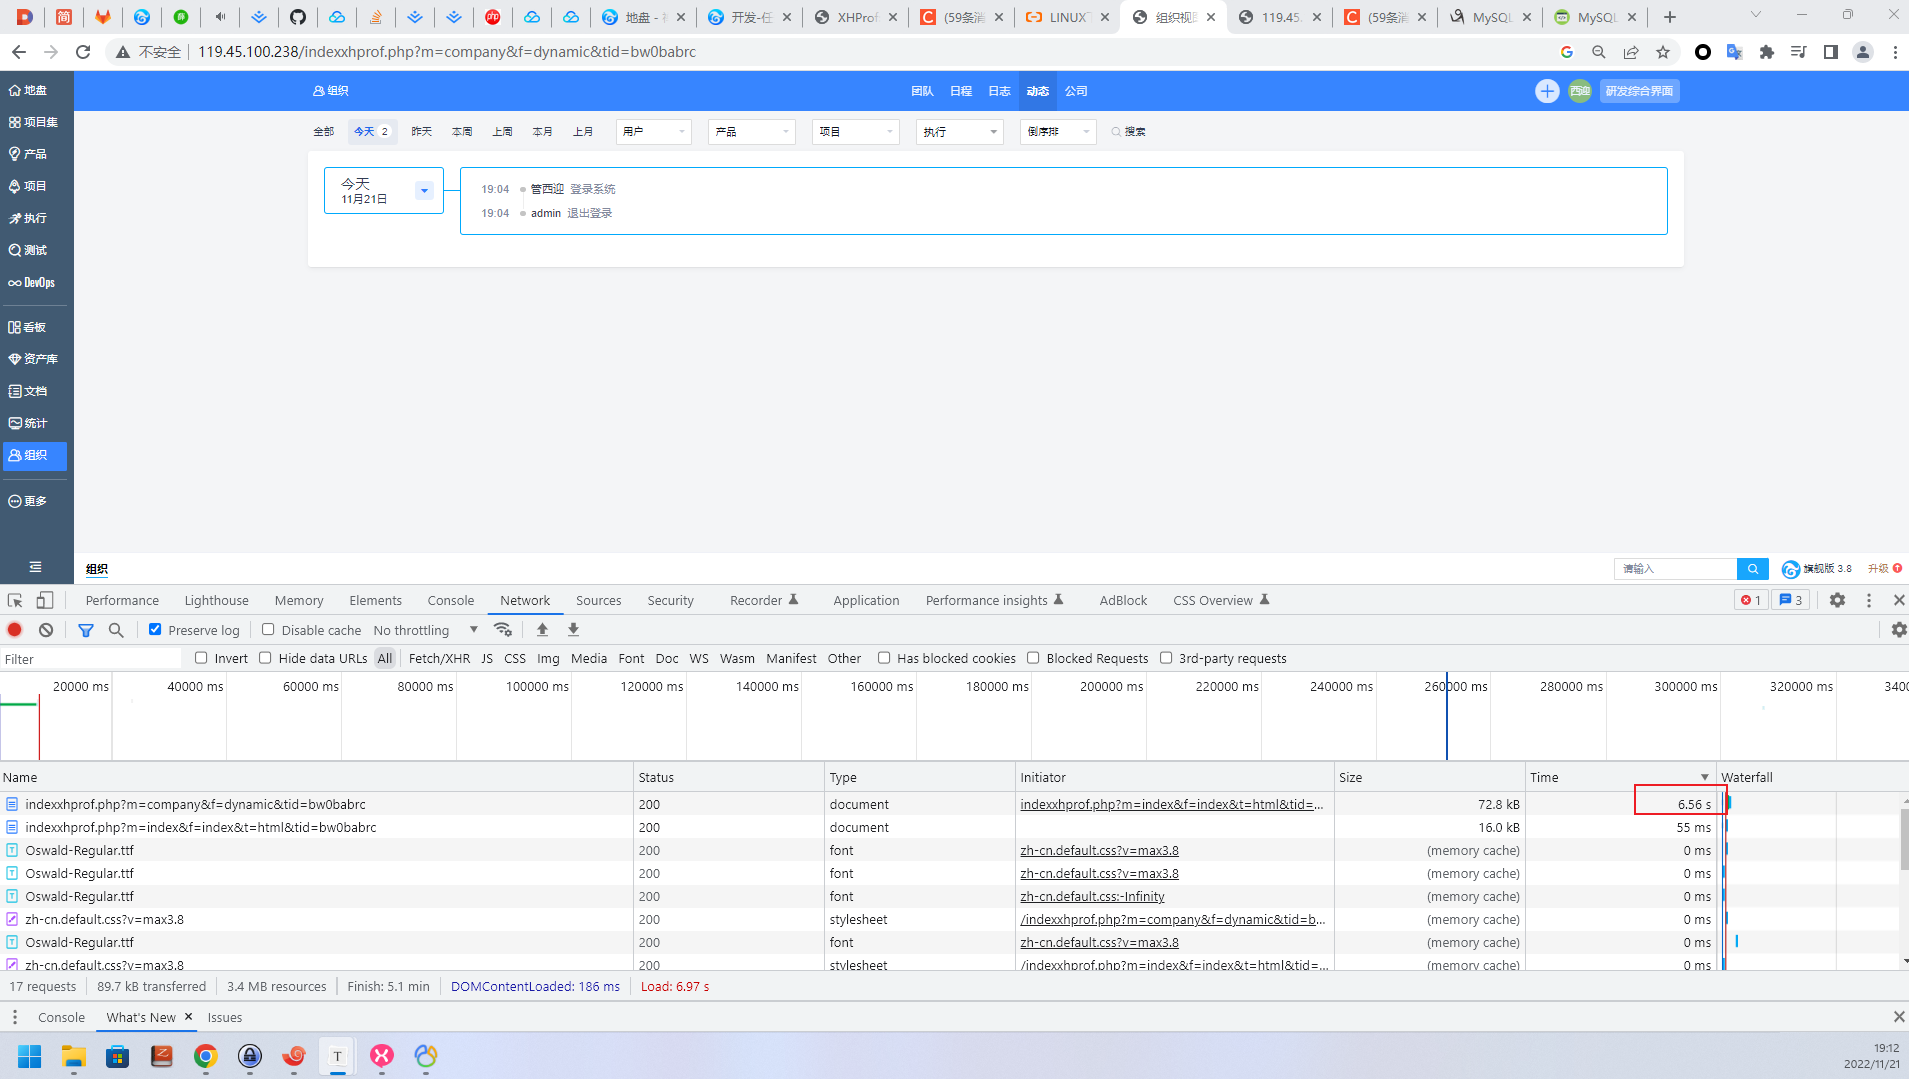
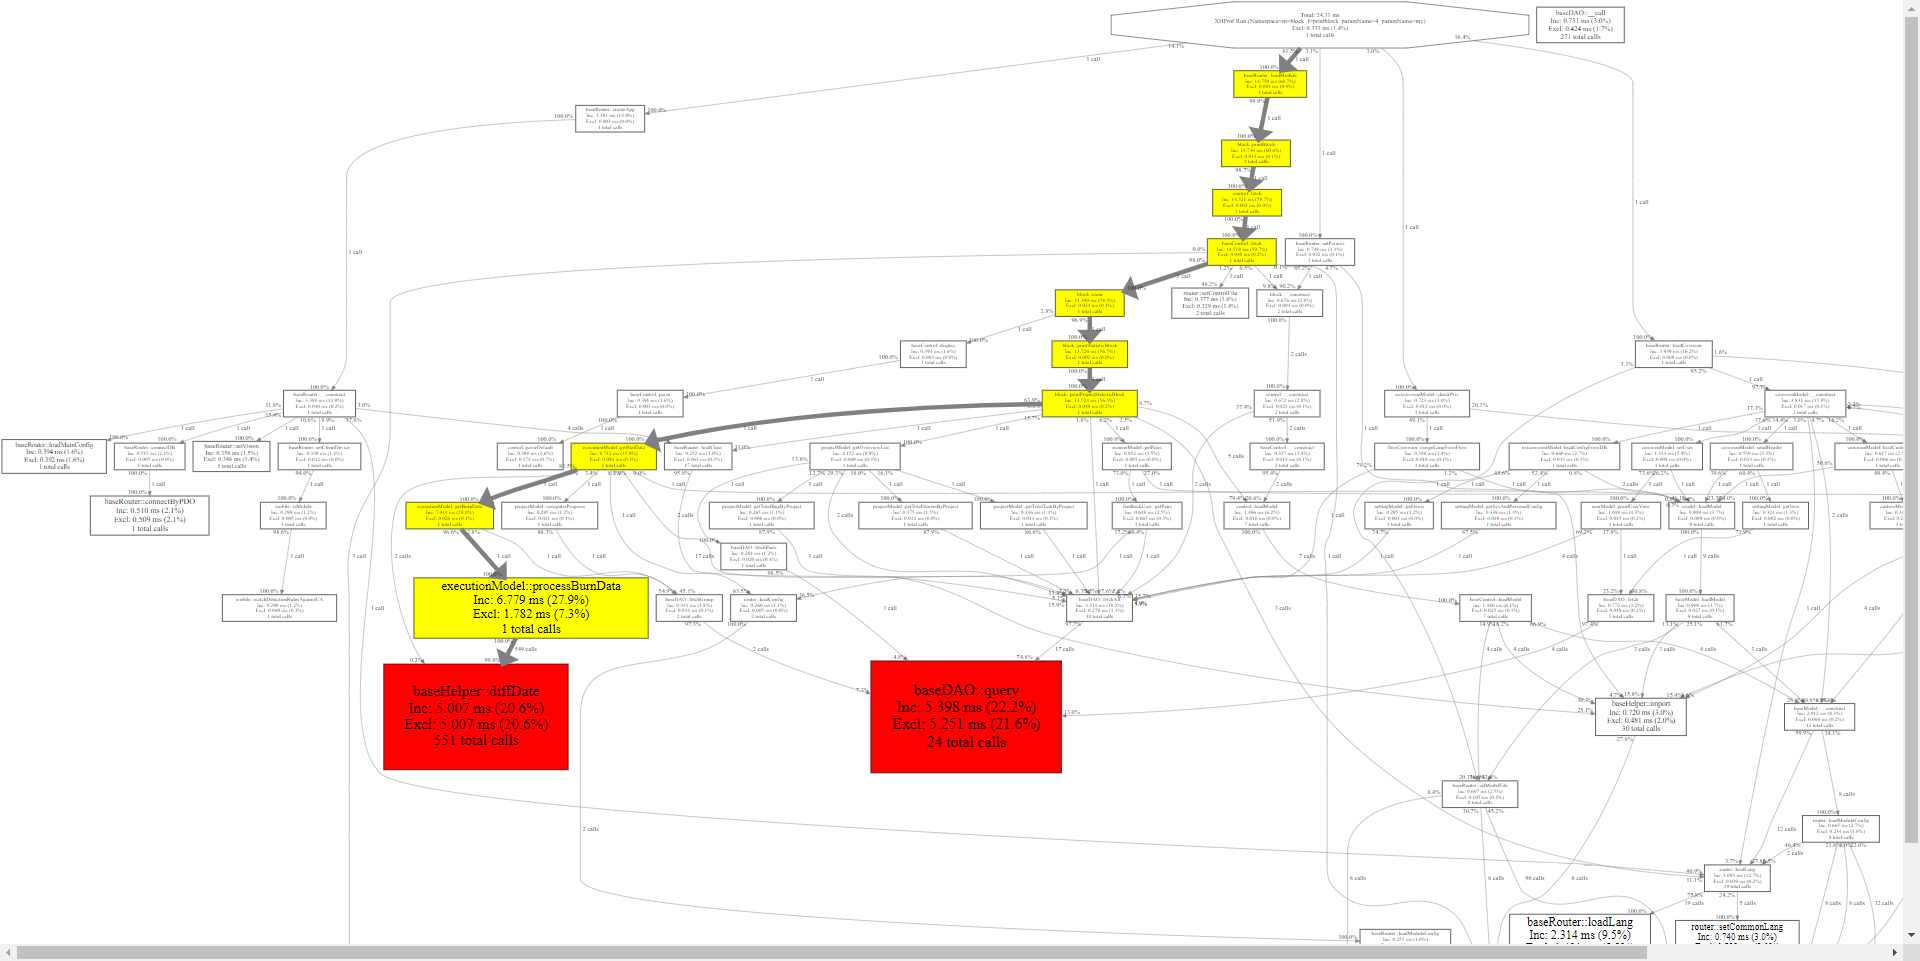
现在有了XHProf,直接看这次请求的调用栈图,定位到是sql查询消耗了大量的时间
可能遇到的问题:
(1)Command ‘phpize’ not found
根据提示安装php-dev
(4)UI界面点击[View Full Callgraph]报错
若提示:failed to execute cmd: “ dot -Tsvg”. stderr: `sh: 1: dot: not found ‘
则是因为未安装graphviz
1 | sudo apt install graphviz |